
GUIDANCE, EXAMPLES AND
TOOLS FOR PROBABILITY
SAMPLING
WHEN DESIGNING
A POPULATION-BASED
BIOMONITORING STUDY
The findings and conclusions in this report are those of the authors and do not necessarily
represent the official position of the Centers for Disease Control and Prevention

Contents
Last mo
dified 05/07/2020
TABLE OF CONTENTS
INTRODUCTION .......................................................................................................................................... 4
Biomonitoring ........................................................................................................................................ 4
Biomonitoring stu
dies........................................................................................................................... 5
Proba
bility sampling designs............................................................................................................... 6
Sources and ty
pes of sampling biases................................................................................................. 7
Sampl
e weights ...................................................................................................................................... 8
STUDY DESIGN GUI
DANCE, EXAMPLES AND TOOLS............................................................................. 9
Flow-cha
rt ............................................................................................................................................. 10
Frequently asked
questions when designing a biomonitoring s tudy..........................................12
Example
s ............................................................................................................................................... 15
1

Last modified 05/07/2020
PREFACE
This document provides guidance, tools and examples to help select an appropriate probability sampling
design for a population-based biomonitoring study or survey within a state. The intended audiences of
this document include the following:
• State health departments and their biomonitoring study collaborators
• Centers for Disease Control and Prevention (CDC) programs that provide resources to their
recipients
• CDC programs and other programs that present surveillance data, including data from
biomonitoring studies and surveys
The guidance will be useful for developing measures to be displayed on the National Environmental
Public Health Tracking Network (Tracking Network), and can be used when:
• Designing biomonitoring studies, with the aim of making data from these studies useful for
public health surveillance
• Evaluating existing biomonitoring data from Tracking Program state/local recipients
• Evaluating existing biomonitoring data from non-Tracking Program state/local recipients and
other agencies or programs
This document only focuses on biomonitoring studies for population health surveillance and on
examples of population-based or probability sampling. This guidance complements information from
other guidance documents developed by the Association of Public Health Laboratories (APHL) and the
Council of State and Territorial Epidemiologists (CSTE):
• APHL’s Guidance for Laboratory Biomonitoring Programs: Developing Biomonitoring
Capabilities: https://www.aphl.org/aboutAPHL/publications/Documents/EH-Oct2019-
Biomonitoring-Guidance.pdf
• CSTE’s Biomonitoring in Public Health: Epidemiologic Guidance for State, Local, and Tribal Public
Health Agencies: http://www.cste2.org/webpdfs/BioMonISFINAL.pdf
The guidance does not replicate topics already addressed in these documents, such as communicating
biomonitoring results, types of specimens, or laboratory protocols for collecting and storing specimens.
2

Last modified 05/07/2020
DEFINITIONS
Target population: The complete collection of observations we want to study
Sample:
a sub-set of a population
Sampling frame: a list or map of sampling units in the population from which a sample may be
selected
Sampling unit: a unit that can be selected for a sample. In studying human
populations, observation
units are
often individuals.
Observation unit: an
object on which a
measurement is taken
Public health surveillance: the
ongoing, systematic
collection, analysis, and interpretation
of health-
related data essential to planning, implementation, and evaluation
of public health
practice
3

Last modified 05/07/2020
INTRODUCTION
Biomonitoring
Biomonitoring assesses human exposure to an environmental chemical by measuring that chemical, its
metabolite(s), or reaction product(s) in human blood, urine, milk, saliva, adipose, or other tissue
[1]. In
the environmental public health field, measurements in individuals are generally taken together to
constitute a population [1]. Biomonitoring helps us determine the environmental chemicals to which
people have been exposed [2]. Biomonitoring can reveal spatial, temporal, and socio-demographic
trends of body burdens of these chemicals in populations for public health surveillance. We can use
these data to identify populations at risk for environmental exposures or to determine the effectiveness
of interventions, laws, and regulations [1].
In exposure studies or surveys, detecting an environmental chemical in human tissue is not enough to
say that the chemical is causing disease
[2]. Other research studies and additional information on health
outcomes are needed to determine whether the chemical level measured is associated with disease [2].
However, results from exposure studies can help inform and prioritize research on health effects from
exposure to environmental chemicals [2].
The Centers for Disease Control and Prevention’s (CDC) National Environmental Public Health Tracking
Program (Tracking Program) maintains the Environmental Public Health Tracking Network (Tracking
Network) (https://ephtracking.cdc.gov/
). The Tracking Network displays standardized environment and
health surveillance data and measures from national, state, and local partners. This information can be
used to show trends over time and make comparisons among states. These data can also be used to
identify common issues among states and support regional responses.
The Tracking Network currently displays the 50
th
and 95
th
percentile and geometric mean concentration
levels of analytes from the following chemical groups:
• metals
• perfluoroalkyl and polyfluoroalkyl substances
• personal care and consumer products metabolites
• pesticide metabolites
• polycyclic aromatic hydrocarbon metabolites
• phthalate metabolites
• disinfection by-products
• volatile organic compounds
• tobacco metabolite
The analytes are measured in urine or blood in the U.S. population, collected as part of CDC’s National
Health and Nutrition Examination Survey (NHANES). The results are presented in the National Report on
Human Exposure to Environmental Chemicals (https://www.cdc.gov/exposurereport/index.html
). These
data are national in scope, and a goal of the Tracking Program is to add state-level biomonitoring data to
the Tracking Network.
4

Last modified 05/07/2020
In 2012, a review of biomonitoring data available to state tracking programs revealed that several of the
same chemicals were measured in state biomonitoring studies [3]. The review also revealed some
disparities in study populations, laboratory methods, and population sampling methods used in studies
that produced these data [3]. These differences, particularly the use of non-probability or convenience
sampling instead of probability population sampling, precluded the development of standard data that
could be representative of a population and displayed on the Tracking Network for public health
surveillance. Unlike probability sampling, convenience sampling does not allow generalization of the
findings to the entire population from which the sample is drawn [4]. However, convenience sampling
can be useful in pilot or exploratory studies, or if limited resources do not allow selecting a
representative sample [4].
Biomonitoring studies
For our review of state biomonitoring data, we broadly classified the biomonitoring studies into the
following categories:
•
Mandatory reporting: Passive collection of data from mandatory reporting of chemical
exposures or body burden levels to a public health agency (e.g., childhood blood lead testing).
•
Population-based study or surveillance: Conducted to detect and measure exposure in a
population (e.g., pregnant women or children). Such studies can be used to study and monitor
spatial, temporal, or demographic differences, or to evaluate the efficacy of public health
actions.
•
Targeted public health investigation: Conducted in response to health concerns in a
community resulting from the discovery of environmental contamination or a cluster of disease
from a possible chemical exposure (e.g., targeting residents using well water, or those near a
hazardous waste site). (Note: some studies target a community or geographic area because of a
health or exposure concern but use a probability sampling design to allow the results to be
representative of that population.)
•
Disease investigation or rapid response: Conducted in response to an exposure event to
evaluate clinical measures in individuals and support diagnosis of poisonings and assessment of
need for medical treatment (e.g., investigating extremely elevated blood lead levels).
•
Research project: Done independently or in collaboration with an existing research effort (e.g.,
Markers of Autism Risk in Babies - Learning Early Signs [MARBLES]).
These categories show that biomonitoring studies are conducted for various uses. The purpose and
objectives of the project will determine the type of biomonitoring study selected, the target population,
sampling frame, and the study design. The study design includes selecting the appropriate population
sampling design. Using the classifications above, this guidance focuses on population-based studies and
surveys or targeted studies within a state. The biomonitoring studies in the categories listed above could
use probability or non-probability sampling methods. However, the focus of this document is on
population-based studies or targeted studies that use a probability sampling design. Such studies
produce findings that can be generalizable to the target population and can be used for population
health surveillance. The study can be a state-level study or community-level within the state.
5

Last modified 05/07/2020
Probability sampling designs
Overview: In a probability sample, each unit in the population has a known non-zero probability of
selection, and units are randomly selected to be included in the sample. This sample can be used to
make inferences about the larger target population [5]. Probability sampling designs all begin by
identifying a sampling frame, which reflects all the persons in the target population of interest. The
individuals or elements of the sampling frame could be aggregated to become primary sampling units
(PSUs) for multi-stage or cluster sampling. A cluster or PSU consists of a group of elements (e.g., census
tracts, ZIP codes, or households). After selecting the PSUs, you can use various approaches to randomly
select study participants within selected PSUs. Some methods for probability sampling include the
following:
1. Simple random sampling of all elements within the sampling frame [6, 7, 8, 9]
Every eligible person w
ithin the population of interest has the same chance or probability of
being selected for the study. Using random selection, a sample of persons from this population
is selected for the study or survey. Other types of random sampling include systematic, stratified
and cluster sampling.
Pros and cons:
S
imple random sampling is the simplest form of probability sampling. However,
you need a complete list of all eligible persons before sampling which might not be available,
especially for large populations. Because simple random sampling gives each eligible person an
equal chance of being selected, it may result in samples spread out over a large geographic area.
The logistics of contacting people over a wide geographic area can be challenging [8, 9]. For
these reasons, simple random sampling is rarely used.
2. One-stage sampling [6, 7, 10]
One-stage sampling requires a list of primary clusters. In a cluster sample, observation units in
the population are aggregated into larger sampling units called clusters. When applying this
method, you first identify the primary clusters (e.g., households) for the study area. The
households are randomly selected from the study area, and all persons in each selected cluster
(household) are then included in the study sample. Example 1A
below provides insights on
applications of one-stage sampling.
Pros and cons:
One stage
sampling is simpler
to implement
than multistage
sampling.
A
complete
list of units
within each sampled primary cluster is needed but
is
rarely available
for
large populations
and
is
difficult to assemble.
Because
of this,
studies often use multistage
sampling.
For one stage sampling t
o be beneficial, any given cluster should reflect the variation in the
overall target population. One stage sampling can introduce cluster effects (i.e., concentration
of people based on similar factors) for population estimates when all persons in selected
clusters are included [9].
3. Multistage sampling [6, 7, 11, 12]
a. Two-stage sampling
6

Last modified 05/07/2020
Two-stage sampling includes a primary and a secondary cluster. The study area
population is divided into groups (primary cluster), then households from these groups
(secondary cluster). Groups are randomly selected, then households within these groups
are randomly selected. All persons within selected households are then included in the
study (See examples 2A-F
below.)
b. Three-stage sampling
Three-stage sampling has 3 levels of clusters. The population in the study area is divided
into primary, secondary, and tertiary sampling units. First, a sample of primary units is
randomly selected. A sample of secondary units is then randomly selected from the
selected primary units. Finally, a sample of tertiary units is randomly selected from the
selected secondary units. (See Example 3A
below.)
Examples of geographic units of primary, secondary and tertiary clusters
One-stage Two-stage Three-stage
•
Primary –
Households
• Primary – Census Blocks
• Secondary – Households
• Primary – Boroughs
• Secondary – Census Blocks
• Tertiary – Households
Pros and cons: Multistage sampling is cost effective and practical, especially for large
populations [9]. For example, it is not possible to list all households in a state for a sample.
However, with two-stage sampling, you could use a county as the primary cluster and census
blocks as the secondary cluster. Then you would only have to identify households in the census
blocks that have been randomly selected for your sample. This makes this method feasible for
large populations. However, multi-stage sampling can produce more sampling errors than other
probabilistic methods [9]. If the members of the different clusters are different from one
another, this reduces the efficiency, i.e., the precision, of the estimates.
4. Using an existing population-based study or survey
Some programs may wish to recruit from existing population-based surveys by asking to add
interest-gauging questions for participation in a biomonitoring study. Information on persons
who agree to participate would then be transferred to the biomonitoring study team, and
separately followed-up on for participation. An example of an existing population-based study
that biomonitoring programs have used is the Behavioral Risk Factor Surveillance System
(BRFSS) survey. (See Examples 4A and 4B
below.)
Pros and cons: This method may be less resource intensive as there is an existing infrastructure
to recruit participants. However, the biomonitoring study would inherit any limitations of the
existing study, for example some existing studies only focus on school-aged children, therefore,
limiting the biomonitoring study to this population.
Sources and types of sampling biases
Under coverage is failing to include all of the target population in the sampling frame [5]. Therefore,
some members of the population are inadequately represented in the sample. This may make it difficult
7

Last modified 05/07/2020
to provide estimates for hard-to-reach or marginalized populations (e.g., certain race/ethnic minorities)
[13].
Voluntary response bias occurs when the sample consists only of those who volunteered to participate
in the survey. That is, the sample members are self-selected volunteers. The respondents may not be
representative of the whole population. This could lead to biased estimates therefore, affecting the
validity of the estimates.
Non-response occurs when only a fraction of the sampled population responds to a survey such that
they are no longer representative of the whole population. That is, the respondents differ meaningfully
from the non-respondents. Low response rates could lead to underestimating certain populations (e.g.,
younger populations)
[13]. This could lead to biased estimates, thereby affecting the validity of the
estimates.
In general, participation rates in epidemiological studies have been declining over the past 30 years [14].
Some reasons for this include the increasing burden for participants from survey assessments, biologic
sampling, and requests for follow-ups [14]. For biological sampling, biomonitoring studies may use
invasively collected matrices such as blood and adipose tissue or non-invasively collected matrices such
as urine and saliva. Non-invasively collected matrices result in increased participation rates [15].
It has also been increasingly difficult to find and talk to potential study participants. Some reasons for
this include the increasing number of unlisted telephone numbers; use of cell phones; telephone
screening; and unsolicited mail and phone calls [14].
Improving participation rates may require evaluating recruitment methods. Face-to-face recruitment
usually has higher participation rates than telephone or less personal methods [14]. Using mixed
methods for data collection, such as an alternative data collection method for non-respondents might
help increase participation. An example is using telephone interviews for persons who did not respond
to a mail survey that is recruiting study participants [14].
Oversampling methods can also be used to sample larger numbers of subpopulations of interest,
thereby increasing their coverage. These methods can be used to improve the reliability and precision of
estimates from subgroups [16].
(See Examples 5A-C below.)
Studies or surveys using a probability sample design can improve the representation of population
subgroups in their sample by using features such as stratification [17]. This involves dividing the
population into smaller, mutually exclusive groups called strata [17]. The strata are formed on
population members shared attributes or characteristics, e.g., income, race/ethnicity and population
density in geographic area. Each stratum is sampled separately using probability sampling methods, and
then the results are combined across strata to provide estimates for the target population [17]. See
examples 2A, 3A and 5B
below fo
r examples of applying stratification.
Sample weights
The weighting of sample data permits researchers to produce estimates of the statistics that would have
been obtained if the entire eligible population had been surveyed [18]. Sample weights can be
considered measures of the number of persons in the target population represented by the particular
sampled participant [18]. Weighting takes into account the different probabilities of selection or
8

Last modified 05/07/2020
inclusion, survey nonresponse, and differences between the distribution of the target population and
the final sampled population [18]. For data analysis, only one final weight per sampled participant is
used which adjusts for all these factors.
Weighting is used for valid statistical inference, to reduce bias, and to keep the weighted sample
distribution close to the distribution of the target population, especially when oversampling is used for
specific subpopulations [19]. Weighting reduces bias, e.g., nonresponse bias, but does not remove all
nonresponse bias.
No one protocol exists for computing weights; rather, computing weights varies among studies
depending on study design, including sample selection and recruitment, and availability of information
on the target population and nonresponse [20]. When computing a weight for each sampled individual,
a combination of the following steps is usually used [20]:
1. Determine the base weight to account for sample selection
2. Adjust for nonresponse
3. Adjust further for undercoverage, i.e., incomplete sampling frame coverage
4. Adjust further to account for distribution in the target population by key characteristics
The final weight for the sampled individual is the product of the value generated in each step above.
This final weight should appear on each respondent data record as a variable to be used in data analysis.
Some datasets could include the individual component weights as well as the final weight.
STUDY DESIGN GUIDANCE, EXAMPLES AND TOOLS
Some considerations and questions to ask when designing a biomonitoring study are listed below. These
also indicate stages at which guidance can be targeted:
• What is the aim of the study?
• What is the target population?
• What probability sampling design will be used?
• Who will be measured (randomly selected persons or everyone in household)?
• What is an appropriate sample size for the study?
• Do I need to oversample certain populations?
• How do I compute weights for study participants?
• What demographic information will be collected and how will it be formatted?
The flowchart, frequently asked questions (FAQ) section with more detailed responses, and examples
that follow provide guidance, examples and tools to help answer these questions. The guidance assumes
that the study aim is population health surveillance, and only focuses on examples of probability
sampling.
9
Last modified 05/07/2020
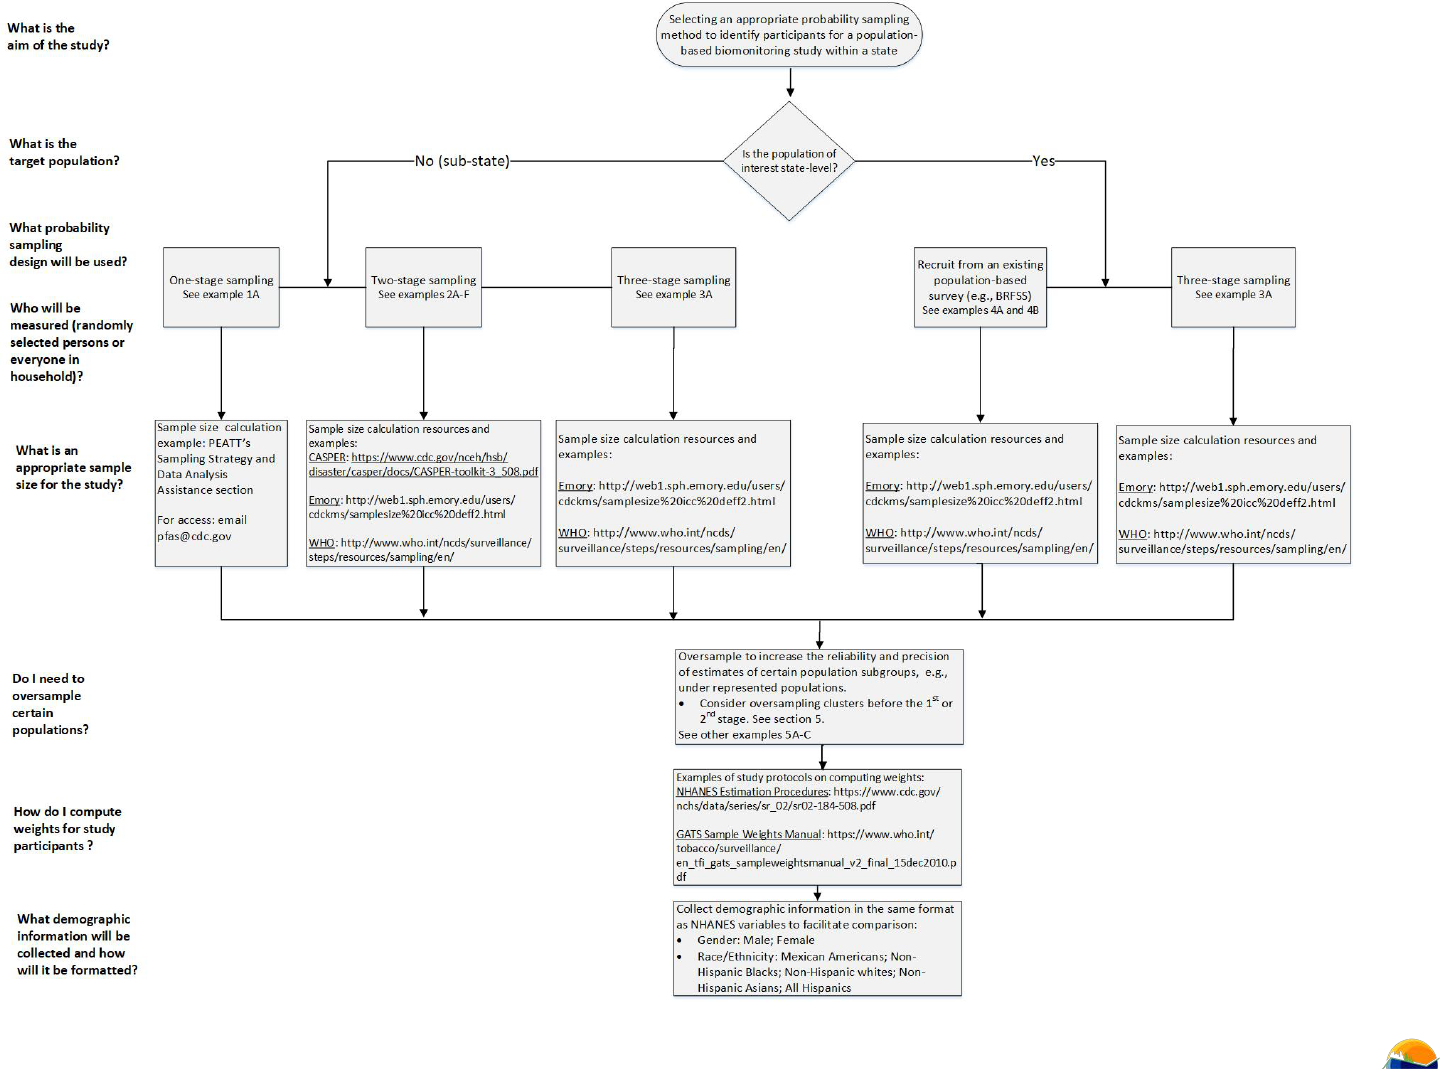
Flow-chart
10

Last modified 05/07/2020
The flow-chart
above guides the selecting of an appropriate probability sampling method to identify participants for a
population-based biomonitoring study within a state.
If the population
of interest is sub-state level, select
from the
following probability sampling designs
and resources:
• One-stage
sampling. See example
1A. Sample size calculation example:
PEATT’s Sampling Strategy and
Data
Analysis Assistance section. For access: email
pfas@cdc.gov.
• Two-stage sampling. See example 2A-F. Sample size calculation resources and examples: CASPER:
https://www.cdc.gov/nceh/hsb/disaster/casper/docs/CASPER-toolkit-3_508.pdf; Emory:
http://web1.sph.emory.edu/users/cdckms/samplesize%20icc%20deff2.html; and WHO:
http://www.who.int/ncds/surveillance/steps/resources/sampling/en/
• Three-stage sampling. See example 3A. Sample size calculation resources and examples: Emory:
http://web1.sph.emory.edu/users/cdckms/samplesize%20icc%20deff2.html; and WHO:
http://www.who.int/ncds/surveillance/steps/resources/sampling/en/
If the population of interest is state-level, select from the following probability sampling designs:
• Recruit from an
existing population-based survey (e.g. BRFSS). See examples 4A
and
4B. Sample size
calculation
resources
and examples: Emory: http://web1.sph.emory.edu/users/cdckms/samplesize%20icc%20deff2.html;
and
WHO: http://www.who.int/ncds/surveillance/steps/resources/sampling/en/
• Three-stage sampling. See example 3A. Sample size calculation resources and
examples:
Emory:
http://web1.sph.emory.edu/users/cdckms/samplesize%20icc%20deff2.html; and
WHO:
http://www.who.int/ncds/surveillance/steps/resources/sampling/en/
For
all probability
sampling designs,
consider
oversampling
to increase
the reliability and precision
of estimates of
certain population subgroups, e.g., under-represented populations. Consider oversampling clusters before the 1
st
or 2
nd
stage. See section 5.
See other examples 5A-C
For all probability sampling designs use the following resources for computing weights for study participants: NHANES
Estimation Procedures: https://www.cdc.gov/nchs/data/series/sr_02/sr02-184-508.pdf; and GATS Sample Weights
Manual:
https://www.who.int/tobacco/surveillance/en_tfi_gats_sampleweightsmanual_v2_final_15dec2010.pdf
For all probability
sampling designs, consider collecting demographic information in the same format as NHANES
variables
to facilitate comparison:
• Gender: Male; Female
• Race/Ethnicity: Mexican Americans; Non-Hispanic Blacks; Non-Hispanic whites; Non-Hispanic Asians; All
Hispanics
11

Frequently asked questions when designing a biomonitoring study
What is the aim of the study?
The focus is on population-based studies or surveys, or targeted studies within a state, which produce findings
that can be generalizable to the target population, and that can be used for population surveillance.
What is the target population?
State- or community-level studies
What probability sampling design will be used?
Last modified 05/07/2020
•
•
•
You will find guidance and examples of some probability sampling designs in the “Examples
” section below.
These include guidance
on
using one-stage, two-stage
and
three-stage designs
and existing population-based
surveys or programs.
•
•
Who will be
measured
(randomly selected persons
or
everyone in
household)?
The goals of the study
and resources
will determine if the
biomonitoring data
will be
collected on
individuals
or
the
entire
household.
What is an appropriate sample size for the study?
Two resources offer examples of sample size calculation:
Per- and Polyfluoroalkyl Substances (PFAS) Exposure Assessment Technical Tools (PEATT)
This resource provides information on how to conduct a one-stage cluster sampling approach and
estimate sample size at the household level. For a copy of this guidance, email the Centers for Disease
Community Assessment for Public Health Emergency Response (CASPER)
This resource provides information on two-stage cluster sampling in which 30 clusters are selected, and
then seven households in each cluster are interviewed. It also provides methods for how to modify this
30 × 7 design. The sampling methodology is available from the Centers for Disease Control and
Prevention at: https://www.cdc.gov/nceh/casper/sampling-methodology.htm.
Two publicly available resources can help you calculate an appropriate sample size for any study:
Sample Size Calculations for a Proportion for Cluster Surveys
Kevin Sullivan in the Department of Epidemiology at Emory University, Atlanta GA, developed this online
program. The program, available at
http://web1.sph.emory.edu/users/cdckms/samplesize%20icc%20deff2.html
, gives investigators various
options for calculating the number of observations per cluster and the number of clusters. It also
provides definitions for terminology, and formulas where necessary.
STEPwise approach to surveillance (STEPS) Sample Size Calculator and Sampling Spreadsheet
This resource from the World Health Organization, available at
http://www.who.int/ncds/surveillance/steps/resources/sampling/en/, provides a spreadsheet with a
sample size calculator. It also provides a sampling spreadsheet with worksheets for:
o
Probability proportional to size (PPS) sampling
o
Simple random sampling, and
12

Last modified 05/07/2020
o Weighting your data
•
Do I
need to oversample certain populations?
We oversample to increase the reliability and precision of estimates of certain population subgroups.
For example, the National Health and Nutrition Examination Survey (NHANES) used oversampling to sample
larger numbers of subgroups of interest, such as minorities, adolescents, and older adults [16]. This increases
reliability and precision of estimates in these population subgroups [16]. Rural populations might be another
subgroup of interest when considering oversampling to help ensure that you achieve a large enough N value for
appropriate statistical power.
For sub-populations that are at least 10% of the total population, a general sample will usually produce reliable
estimates [21]. For subpopulations between 1% and 10% of the total population, the oversampling methods
described in the Examples 5A-C
below are needed [21].
By considering oversampling clusters before the first or second stage, you have a better opportunity to net a
desired sample size.
Possible oversampling methods include increasing the number of units (e.g., census blocks) in your first
stage [22]. You could also increase the number of units (e.g. households) in the second stage [22].
An example of oversampling to increase cluster selection is a modified application of the CASPER study
design whereby the 30 × 7 design is modified to a 35 × 7 therefore increasing the N value by 16.6% [23].
The NHANES study design, as another example, draws its sample in the following stratified, four stages [24]:
• Stage 1: PSUs are first stratified according to population size, and then PSUs are selected from each
stratum. These are mostly single counties or, in a few cases, groups of contiguous counties with
probability proportional to a measure of size (PPS).
• Stage 2: The PSUs are divided up into segments (generally city blocks or their equivalent). As with each
PSU, sample segments are selected with PPS.
• Stage 3: Households within each segment are listed, and a sample is randomly drawn. In geographic
areas where the proportion of age, ethnic, or income groups selected for oversampling is high, the
probability of selection for those groups is greater than in other areas.
• Stage 4: Individuals are chosen to participate in NHANES from a list of all persons in selected
households. Individuals are drawn at random within designated age-sex-race/ethnicity screening
subdomains. On average, 1.6 persons are selected per household.
In
stage 3,
households from each segment are randomly drawn. For geographic
areas where
the proportion of
age, ethnic, or income groups selected for oversampling is high, the probability
of selection for those groups is
greater than in other areas
[16]. This can be replicated in other biomonitoring
studies that apply probability
sampling to
oversample populations
of interest.
• How do I compute weights for study participants?
Two examples of study protocols that can serve as resources for computing weights are listed below:
• NHANES provides information on the health and nutritional status of the noninstitutionalized civilian
resident population of the United States. The sample for NHANES is selected using a complex, four-
stage sample design. NHANES carries out sample weighting in three steps. The first step computes base
13

Last modified 05/07/2020
weights to compensate for unequal probabilities of selection. The second step adjusts for nonresponse
to reduce bias. In the third step, sample weights are post stratified to the reference (target) population.
The procedures for computing these weights are detailed in the National Health and Nutrition
Examination Survey, 2015 – 2018: Sample Design and Estimation Procedures document
(https://www.cdc.gov/nchs/data/series/sr_02/sr02-184-508.pdf
).
• The Global Adult Tobacco Survey (GATS) is a nationally representative household survey of adults 15
years of age or older, and its used to enhance the capacity of countries to design, implement and
evaluate tobacco control interventions. GATS uses a geographically clustered multistage sampling
methodology to identify households to be included in the study. GATS recommends a three-step
approach in computing sample weights: compute a base weight for each sample respondent, adjust the
base weights for nonresponse, calibrate the adjusted weights to known population totals. Their Sample
Weights Manual
(
https://www.who.int/tobacco/surveillance/en_tfi_gats_sampleweightsmanual_v2_final_15dec2010.p
df) details requirements and recommendations on how to approach computing sample weights for a
country GATS. The step-by-step
manual can be modified to country-specific sample design and analysis
needs.
•
What demographic information will be collected and how will
it
be formatted?
Consider collecting demographic information in the same format as NHANES so that you can compare local
estimates with national estimates.
14
Examples
1. One-stage sampling
Identify the primary cluster unit (e.g., households). Households are randomly selected from the study area. All individuals in each selected cluster/household
are included in the sample.
Example 1A: Per- and Polyfluoroalkyl Substances (PFAS) Exposure Assessment Technical Tools (PEATT) — One-
stage cluster sample enrolling entire households within a PFAS-affected community
Last modified 05/07/2020
Program: Centers for Disease Control and Prevention (CDC)
Access: To request PEATT documentation, email CDC at pfas@cdc.gov
Methods:
• The sampling frame is a list of households in a community of interest
• A complete listing of all households within the samp
ling frame is obtained
• A sample size for the study is determined
• Househo
lds from the list are randomly selected to fit th
e selected sample size
• All household members are recruited to participate in the study
Pr
os
• Statistically based
. Information learned
can be applied to others in the tar
geted
population (those not tested).
• Presents formulas to be used to
determine the sample size with step-
by-step example of how to apply it.
• Mentions Census.gov as backup
resource if municipal water/well
sampling frame information are
unavailable.
• Gives two options for calculating
sample size based on whether loc
al
Cons
• Information l
earn
ed
can only be applied to others
within the sampling frame.
• Need
to have some level of statistical experience
to
understand the formulas. Most significantly,
applying the formulas requires a sampling frame
which requires a complete list of all households in
the area and the total population of the
geographic area of interest. For water
contamination issues, a list of those on public
water or on private well water is needed,
depending on the exposure; the latter may be
hard to come by.
Recommendations for
use and m
odifications to
consider
• Can modify to select
sampling fram
e based on
geographic area (i.e., not an exposed community).
• Can only use this strategy if you know the number
of household
s within the geographic area being
assessed (or census data), total population of the
area, and analyte data (either from preliminary
testing in that area or from NHANES).
15

Last modified 05/07/2020
preliminary biomonitoring results from
the exposed community are av
ailable
and if not, then states to use NHANES
data for the analyte of interest.
• Gives formula for adjustment of
ho
usehold
sample size based on an
estimate of non-response.
•
Census.gov
information on housing units
is only
available at
the state
and
county level and for
towns and
cities with populations greater than
5,000. That means
one
can't use
the calculations
in the PEATT for communities lacking addresses of
households
on municipal water
supply or
private
wells
(if exposure applies
to analyte[s]
of interest)
or those
with
<5,000 people.
•
The formulas can't be used if neither preliminary
nor NHANES data are available (e.g.,
for emerging
contaminants).
•
Need to have an idea
of non-response rate to use
the formula.
2. Two-stage sam
pling
The state
populatio
n is divided into groups (primary cluster). Groups are randomly selected, then persons within these groups are randomly selected and
included in the study.
Example 2A: Survey of the Health of Wisconsin — Two-stage cluster sampling
Reference: Nieto FJ, Peppard PE, Engleman CD, McElroy JA, Galvao LW, Friedman EM, et al. The Survey of the Health of Wisconsin (SHOW), a novel
infrastructure for population health research: rational and methods. BMC Public Health 2010; 10:785. doi: 10.1186/1471-2458-10-785
Link: https://www.med.wisc.edu/show/
Methods:
• The target population at initial selection is Wisconsin non-institutionalized/non-active duty adult residents aged 21 – 74 years
• The sampling frame is a list of census block groups or clusters of census block groups in Wisconsin state
• The initial sampling frame is constructed using Census 2000 data to generate 4,388 census blocks groups (CBG) or clusters of CBGs as the primary
sampling units (PSUs)
• CBGs with <40 households are merged with a neighboring CBG to form a cluster
• CBGs that fall in sovereign native American nation territories with no authorization to be included in survey are excluded
16
Last modified 05/07/2020
• PSUs are stratified according to 1) congressional district and 2) percentage of population living below 100% poverty level
• CBGs are randomly selected within each stratum using the Sampford explicit probabilities proportional to size without replacement method (36-72
CBGs usually are selected)
• A list of households addresses by CBG is generated using U.S. Postal Service sequence delivery files
• From the household sampling frame, 12-38 addresses are randomly selected using simple random sampling
Pros
• Provides a mechanism to
collect subjective (self-
reported) and objective
(physical exam and
biospecimen) individual
data.
Cons
• Results are limited to those from the same
communities.
• Requires many resources.
• Household canvassing requires significant staff
numbers to accomplish in timely manner.
Recommendations for use and modifications to consider
• SHOW infrastructure can be used to do specific biomonitoring
studies.
• To increase participation, a public relations campaign is
launched in communities 6-8 weeks before recruitment in
that location.
• The selected households are mailed an information package
1-3 weeks before the team arrives in the selected block
group. The package includes a description of the project, how
households were selected, and benefits of participation.
Example 2B: Minnesota East Metro PFAS Biomonitoring Projects —Two-stage cluster sample enrolling randomly-
selected adults likely to be exposed to PFAS and from a PFAS-affected community
Program: Minnesota Biomonitoring: Chemicals in People, Minnesota Department of Health.
Reference: Landsteiner A, Huset C, Johnson J, Williams A. Biomonitoring for perfluorochemicals in a Minnesota community with known drinking water
contamination. J Environ Health. 2014 Dec;77(5):14-9
Link: https://www.health.state.mn.us/communities/environment/biomonitoring/projects/pfas.html
Methods:
• The study location was a community with known PFAS exposures
• The sampling frame is a list of households from two groups in the community:
o People using community water— billing addresses of all households receiving municipal water service from city of Oakdale before January 1,
2005 (before the remediation)
o People using private wells— private well sampling results were used to identify all households with PFOS or PFOA above trace levels
17
Last modified 05/07/2020
•
A household survey was se
nt to a random sample of people on water billing records, and to all homes with contaminated private wells
• The households were as
ked to enumerate all eligible adults who lived there. Eligibility was restricted to those who lived in Oakdale before January 1,
2005
• A sample size, deter
mined by state legislature, was identified for the study
• Eligible adults wer
e randomly selected from the list to fit the selected sample size. For anyone who declined, replacements were selected
Pros
• Popu
lation-based sample.
• Results can be applied to others from
the same communities (those not
tested).
• Using an existing list as sampling frame
was an ec
onomically efficient means of
recruitment.
•
With extensive prior agency outreach
and co
mmunity interest, participation
rates can be high.
• These sampling frames work especially
well when
water is the source of
exposure.
• Able to assess some differences
betw
een participants and refusals.
Cons
• Res
ults are limited to thos
e from the same
communities and not the general
population.
• Renters and non
-homeowners are
underrepresented on water billing lists, so
may be missing important, possibly
vulnerable sub-populations. (This was
addressed in the third study by including a
group of renters, but it was difficult to find
a sampling frame and participation rates
were lower.)
Recomm
endations for use and modifications to consider
• Community outre
ach key to make residents familiar with
issue/study and likely to participate.
• Important to consider health equity issues and alternate
ways to include renters and non-homeowners.
• Don’t h
ave to restrict residence length.
Example 2C: Washington Environmental Biomonitoring Survey (WEBS) — Two-stage sampling to measure
exposure in the general population of WA state
Program: Washington State Department of Health
Links: https://www.doh.wa.gov/Portals/1/Documents/1500/WEBSOverview2013.pdf
https://www.doh.wa.gov/Portals/1/Documents/1500/WEBSFactSheet.pdf
Methods:
• The study area is Washington State
18
Last modified 05/07/2020
• The sampling frame is a list of census bl
ock groups in Washington state
•
70 census block groups were randomly selected from the state
• 27 housing units were ran
domly selected from each census block group
• All household residents aged 6 years and older were invited to participate in the survey
• 1422 participants from 666 households were included in the survey
Pros
• Populat
ion-based sample.
• Results can be applied to others from the
same communities (those not tested).
• Measured analytes also measured by
NHANES: speciated arsenic, 12 metals
(antimony, barium, beryllium, cadmium,
cesium, cobalt, lead, molybdenum,
platinum, thallium, tungsten and
uranium), pesticide metabolites
(chlorpyrifos, and four pyrethroids),
bifenthrin metabolites, BPA and
phthalates.
Cons
• Children <6 years were
not included
in the sample.
Recommenda
tions for use and modifications to consider
• Online publication of the re
sults by population
characteristics, which the local health departments and
community can access to understand the chemicals
p
opulations are being exposed to.
Example 2D: Community Assessment for Public Health Emergency Response (CASPER) — Two-stage cluster
sampling design in which 30 clusters are selected and then seven interviews are completed in each of the 30
clusters
Program: Centers for Disease Control and Prevention (CDC)
Link: https://www.cdc.gov/nceh/hsb/disaster/casper/overview.htm
Methods:
• A sampling frame boundary is defined and includes a list of census blocks in that boundary
• A sample of 30 census blocks, weighted by household numbers (using information from the U.S census), is selected from within the sampling frame.
Use sampling with replacement
• Census blocks are visited by on-the ground teams over 3 days to gather seven interviews per census block
19

Last modified 05/07/2020
• Each interview asks about everyone within the entire household
• Residential units are selected systematically by dividing total units (using census information) by 7 and visiting each nth residence. Units are replaced
by adjacent units after three failed attempts at contact
• Results are weighted based on census block size and completion rate (if unable to achieve seven interviews in each block)
Pros
• Some states/counties/localities
already have experience in
using CASPER for post-disaster
health surveillance and disaster
preparation.
• A national disaster
epidemiology coalition is
available for support.
Cons
• A list of all clusters within the sampling frame is
required.
• Household canvassing requires significant staff
numbers to accomplish in timely manner.
Recommendations for use and modifications to consider
• CASPER sampling methodology can be used to identify
potential study participants. However, other appropriate and
more feasible methods must be used to contact those
persons and to collect their samples for the study (e.g., via
mail).
• In rural areas, clusters might have fewer than seven
households which might require modifying the traditional 30
(clusters) x 7 (households) design of CASPER. Rural area
clusters (census blocks) with fewer than seven households
might make it hard for sampling teams to interview the
needed number from that cluster.
Example 2E: Optimizing cluster survey design for planning schistosomiasis preventive chemotherapy —School-
based two-stage cluster sampling implementation
Reference: Knowles SCL, Sturrock HJW, Turner H, Whitton JM, Gower CM, Jemu S, et al. Optimising cluster survey design for planning schistosomiasis
preventive chemotherapy. PLoS Negl Trop Dis 2017; 11(5): e0005599.
Link: https://doi.org/10.1371/journal.pntd.0005599
Methods:
• The sampling frame was a list of primary schools in a health or educational school district
• 15-20 primary schools were randomly selected, and then 30 children were randomly selected per school
• Children aged 10 - 14 years were eligible for participation
• Eligible children were line up and a sampling interval was used to select the required 15 participants of each sex
• The sample size was determined based on precision-based sample size calculations that took into account spatial heterogeneity in prevalence of
schistosomiasis using methods from Lohr, S. Sampling: design and analysis. Boston , MA: Cengage Learning; 2010
20
Last modified 05/07/2020
Pros
• Could use schools as
distribution points for
recruitment material and
collection points for
samples.
Cons
• Designed to sample school age children. Would
need to send information home with children to
families to recruit for sampling. Would be biased
toward people with school-age children.
Therefore, this structure might not be suitable for
other biomonitoring studies.
• Home-schooled children are left out of sampling
frame.
• Study was based on detection of schistosomiasis
endemicity. The number needed to sample will
likely not translate exactly for biomonitoring.
Recommendations for use and modifications to consider
• Could be modified at the levels of sampling such that schools
are randomly selected from within a county or a primary care
area.
• Could also do probability-based sampling for the first stage
instead of simple random sampling to oversample more
populated areas or certain populations of interest.
Example 2F: Two-stage cluster sampling based on census block and household units
Reference: Smith DA, Akira A, Hudson K, Hudson A, Hudson M, Mitchell M, Crook E. The effects of health insurance coverage and the doctor-patient
relationship of health care utilization in high poverty neighborhoods. Prev Med Rep 2017; 7:158–61.
Link: https://doi.org/10.1016/j.pmedr.2017.06.002
Methods:
• The target population is defined based on census tract
• The primary sampling frame is a list of census blocks in a defined census tract, and the primary sampling unit is randomly selected census blocks from
within the tract, where the number of census blocks selected is proportional to the number of blocks in the tract
• The secondary sampling unit is five randomly selected housing units from within each sampled census block
• The selected houses are contacted either by letter or a home visit
Pros Cons Recommendations for use and modifications to consider
21

Last modified 05/07/2020
• By randomly selecting
houses from within a census
block, eliminates the labor-
intensive need to go door-
to-door and could recruit by
mailer.
• Relatively simple strategy.
• Recruitment of five selected households might be
difficult if by mail (generally low response rate).
• Five randomly selected houses might not be
enough.
• Could be modified to where sampling frame is county, primary
sampling unit is census tract, and secondary unit is census
block. Entire blocks could be contacted by overlaying blocks
with a GIS layer with address and zip, and send mailers
targeting census block.
22
3. Three-stage cluster sampling
The population is divided into primary, secondary and tertiary sampling units (e.g., counties, cities, households). First, a sample of primary units is randomly
selected. A sample of secondary units is then randomly selected from the selected primary units, then a sample of tertiary units is randomly selected from
the selected secondary units.
a. Three-stage cluster sampling at the city-level
Example 3A: New York City Health and Nutrition Examination Survey (NYC-HANES)
Last modified 05/07/2020
Links: http://nychanes.org/wp-content/uploads/sites/6/2015/11/NYC-HANES-Training-Slides_part-1_08222016.pdf
https://www1.nyc.gov/assets/doh/downloads/pdf/hanes/hanes-manual.pdf
https://www.ncbi.nlm.nih.gov/pubmed/26844121
https://www.ncbi.nlm.nih.gov/pubmed/16776895
Methods:
•
New York City i
s divided into about 20,000 segments, then 144 segments are randomly selected; stratified by borough
• The primary sampling unit is segments which are an aggregation of census block groups (probability proportional to size)
• The secondary sampling unit is households within the primary sampling unit (simple random sample)
• The tertiary sampling unit is participants within households (simple random sample)
Pros
• Instruments and laboratory
methods benchmarked
against the national HANES.
Cons
• Only city-wide estimates available.
• Small sample sizes for some demographic
subgroups.
•
Selection/non-response bias (partially corrected
through non-response weighting adjustment).
Recommendations for use and modifications to consider
• Can be modified to where the sampling frame is the state.
23

4. Recruit from an existing population-based survey or program
Last modified 05/07/2020
Some programs may wish to recruit from existing population-based surveys by asking to add interest-gauging questions for participation in a biomonitoring
study. Information on persons who agree to participate would be transferred to the biomonitoring study team, and separately followed-up on for
participation.
a) The Behavioral Risk Factor Surveillance System (BRFSS) is an example of an existing population-based survey that some states have worked with. BRFSS
uses a disproportionate stratified sample design. Landline users are divided into two groups (high-density and medium-density), which are sampled
separately. To provide adequate sample sizes for smaller geographically defined populations of interest, many states sample disproportionately from
strata that correspond to sub-state regions. Since 2011, BRFSS has been conducting surveys by landline and by cellular telephone. In conducting the
landline telephone survey, interviewers collect data from a randomly selected adult in a household. In conducting the cellular telephone survey,
interviewers collect data from those adults who answer the cellular telephone call and lives in a private residence or college housing.
Example 4A: Behavioral Risk Factor Surveillance System (BRFSS) – Disproportionate stratified sample design.
Program: Centers for Disease Control and Prevention (CDC)
Methods:
• In conducting the landline telephone survey, interviewers collect data from a randomly selected adult in a household
•
Landlines are divided into tw
o groups (high-density and medium-density), which are sampled separately
• In conducting the cellular telephone survey, interviewers collect data from adults answering the cellular telephones residing in a p
rivate residence or
college housing
• State health departments collaborate during survey development and co
nduct the interviews themselves or use contractors
Pros
• D
oes not require many
res
ources for sampling.
• Can add questions.
Cons
• N
on-response bias could be large.
• E
ven though BRFSS participants are randomly
s
elected, the biomonitoring sampling frame
includes only those who participate in BRFSS, and
then say yes to participating in the biomonitoring
program. The program then follows up with these
people.
Rec
ommendations for use and modifications to consider
• Can be costly to contact all interested participants to collect
info
rmation on them:
o Because the number identified from the B
RFSS survey
could be large (>2,000), consider using a call center to
contact all interested participants.
o Also consider having a website for i
nterested
participants, where they can provide more
information about themselves (e.g., demographic
24
Last modified 05/07/2020
• Can be costly for some states to add
biomonito
ring questions to the BRFSS
questionnaire.
• Can be a significant time delay between
when
people are surveyed by BRFSS and when they are
re-contacted by the
biomonitoring staff.
information)
to reduce costs of contacting
each
participant
to collect
this information.
o The website can
provide
inter
ested participants
with
information
on
what samples are needed and where
to drop
them
off (e.g., at a hospital). This requires
partnership with health care providers
or local health
departments
to
collect and store samples.
Example 4B: Minnesota Healthy Rural and Urban Kids Project — One-stage cluster sample enrolling preschool-
aged children from selected communities in the state.
Program: Minnesota Biomonitoring: Chemicals in People, Minnesota Department of Health.
Link: https://www.health.state.mn.us/communities/environment/biomonitoring/projects/ruralurbankids.html
Methods:
• The study location is two geographically distinct communities in the state with different community exposure concerns: 1) group of rural counties in
North-Central Minnesota, and 2) two ZIP codes in urban North Minneapolis.
•
The sampling frame is prescho
ol-age children who live in these areas and came in for their required pre-kindergarten early childhood screening visits
during June – September 2018. Early childhood screening programs are administered by school districts (Minneapolis) or, in some cases, local public
health agencies (rural counties in the study).
• Early childhood screening staff recruited children and conduct
ed data collection:
o Staff contacted parents with appointments scheduled and informed t
hem about possibility to participate.
o On the day of visit,
staff introduced the study again to families, conducted informed consent, administered the survey while child was being
screened, and collected the urine sample.
• Eligibility was restricted to childre
n whose parents reported that their child could provide a urine sample (i.e., potty-trained and no health issues that
would interfere), and to one child per family.
• A sample size for study was identifie
d, and monthly target recruitment goals were set.
Pros
• Children are re
quired to complete Early
Childhood Screening before entering
kindergarten, so the sampling frame is based
Cons
• Results are limited to children from
the selected communities and not to
the state-wide population.
Recommendations for use and modifications to consider
• Because program happens across the state, can tailor
geography to meet study/community needs.
25

Last modified 05/07/2020
on an existing, universal program for
preschool-aged children.
• Contracting with local staff from existing
programs was economically efficient and
helped achieve high participation rates
–
people
knew and trusted them.
• Being able to complete all components
of
the study when
families came in for their
pre-scheduled screening visit increased
retention, survey completion and sample
collection.
• Study embedded in
existing public health
programs that
focus on
children’s health and
have strong interest in results.
• Collecting a blood sample would be
more complicated and resource-
intensive with this design.
• Lack of comparison data from NHANES
and other sources for this age group.
Note: NHANES samples children from
ages 3 years and older for some
analytes (not all).
5. Over sampling populations
Oversampling is done to increase the reliability and precision of estimates of certain population subgroups.
For example, studies such as the National Health and Nutrition Examination Survey (NHANES) used oversampling to sample larger numbers of
subgroups of interest such as minorities, adolescents, and older adults [16].
This increases the reliability and precision of estimates in these population
subgroups [16]. Rural populations may be another subgroup of interest when considering oversampling to help ensure that you achieve a large enough
N value for appropriate statistical power.
Co
nsideration of oversampling clusters before the first or second stage provides a benefit for netting a desired sample size:
Possible oversampling methods could include increasing the number of units (e.g. census blocks) in your first stage [22].
In the second stage the
number of units (e.g. households) also can be increased [22].
An
example of oversampling to increase cluster selection is a modified application of the CASPER study design whereby the 30 × 7 design is
modified to a 35 × 7 therefore increasing the N value by 16.6% [23].
The NHANES study design, as another example, draws its sample in the following stratified, four stages [24]:
• Stage 1: PSUs are first stratified according to population size, and then PSUs are selected from each stratum. These are mostly single counties
or, in a few cases, groups of contiguous counties with probability proportional to a measure of size (PPS).
26

Last modified 05/07/2020
• Stage 2: The PSUs are divided up into segments (generally city blocks or their equivalent). As with each PSU, sample segments are selected with
PPS.
• Stage 3: Households within each segment are listed, and a sample is randomly drawn. In geographic areas where the proportion of age, ethnic,
or income groups selected for oversampling is high, the probability of selection for those groups is greater than in other areas.
• Stage 4: Individuals are chosen to participate in NHANES from a list of all persons residing in selected households. Individuals are drawn at
random within designated age-sex-race/ethnicity screening subdomains. On average, 1.6 persons are selected per household.
In stage 3, where households from each segment are randomly drawn, for geographic areas where the proportion of age, ethnic, or income groups
selected for oversampling is high, the probability of selection for those groups is greater than in other areas [16]. This can be replicated in other
b
iomonitoring studies that apply probability sampling to oversample populations of interest.
For su
b-populations that are at least 10% of the total population, a general sample will usually produce reliable estimates [21]. F
or, subpopulations
between 1% and 10% of the total population, the oversampling methods described in the tables below are needed [21].
Example 5A: Screening—Used when sampling frame does not have the subpopulation domain identifiers.
Reference: Kalton G. Methods for oversampling rare subpopulations in social surveys. Survey Methodol. 2009;35(2):125–41
Methods:
•
Used if a sampled person’s membership in a rare population can be determined inexpensively, e.g., from responses to a few questions
• A large first phase sample size is identified from wh
ich to select members of subpopulation of interest
• This is the minimum sample size th
at will produce the required (or larger) sample sizes of subpopulations of interest
• All the members of the subpopulations o
f interest are then included in the second phase sample
Pros
•
Uses probability sampling
methods.
Cons
• Large sample size required.
• Requires expensive procedures.
• With screening, the sample size for a rare
po
pulation is a random variable and could be
more or less than expected.
• Noncoverage can be a significant problem when
large-scale screening is used to identify rare
populations.
Rec
ommendations for use and modifications to consider
• A large screening sample size is required to get an adequate
sample size for the subpopulation(s) of interest,
o Use an inexpensive mo
de of data collection (e.g.,
telephone surveys or mail questionnaire).
o Share costs across surveys – e.g
., partner with
existing population-based surveys
• When possible and useful, pe
rmit the collection of screening
data from persons other than those sampled. For example,
27

Last modified 05/07/2020
o Even though a frame has good ov
erall
coverage, its coverage of a rare domain
might be inadequate
other household members may be able to accurately report
the rare population status of the sampled member.
•
Use a sampling fraction to be
st ensure the sample size will
meet the minimum needed for a rare population. Sample
fractions can be in context of subdomain such as age, sex or
income groups.
• Consider non-response rates.
• Allow for under-rep
resentation by taking into account issues
such as noncoverage, non-response or misclassification of
domain membership at the design stage to produce the
required sample size.
Example 5B: Disproportionate stratification—Identifying strata based on subgroups of interest
Reference: Kalton G. Methods for oversampling rare subpopulations in social surveys. Survey Methodol. 2009;35(2):125–41.
Methods:
• Used if the rare population is concentrated in certain identifiable parts of the sampling frame
• Ma
ke sure subpopulation is more prevalent in the strata
• Make sure the strata has a high proportion of subpopulation
• The cost of collecting data from the subpopulation should not be high
Pros
• Disproportionate
stratification, with higher
sampling fractions in the
strata where th e prevalence
of the rare population is
higher, can reduce the
amount of screening
needed.
Cons
• Assumes the prevalence of the rare population in
each stratum is known.
• Assumes the identification of rar
e populations is
relatively easy.
• Errors in the prevalence es
timates will reduce the
precision gains achieved with disproportionate
stratification and could even result in a loss of
precision for the survey estimates.
Rec
ommendations for use and modifications to consider
• This method will yield substantial gains in efficiency if the
following conditions hold:
o The rare population mu
st be much more prevalent in
the oversampled strata
o The over-sampled strata must contain a high
p
roportion of the rare population
o The cost of the
main data collection per sampled unit
must not be high
• If a list with names is accessible (e.g., telephone numbers
m
erged with U.S. Postal Service delivery sequence file
addresses), the names can be used to build strata of likely
28

Last modified 05/07/2020
members of some racial/ethnic groups. Nam
es can be
effective for identifying certain ethnic groups.
•
If area sampling is used, data from the
last census and other
sources can be used to allocate the area clusters to strata
based on their prevalence estimates for the rare population.
Example 5C: Two phase sampling—Used when accurate identification of subpopulation members is expensive
Reference: Kalton G. Methods for oversampling rare subpopulations in social surveys. Survey Methodol. 2009;35(2):125–41.
Methods:
• Used if a sampled person’s membership in a rare population can only be determined using expensive methods, e.g., medical examinations
• Start with an imperfect screening classification in the firs
t phase e.g. screening questionnaires with high sensitivity to detect subpopulation of interest
• Follow with accurate identification for a disproportionate stratified subsample in sec
ond phase (e.g., assessment by medical personnel)
Pros
• Ben
eficial when first phase
accu
rate identification is not
known or expensive.
Cons
• A fairly
common practice with two-pha
se designs
is to take no second-
(or third-) phase sample from
the stratum of
those classified as nonmembers
of
the rare domain, based on
their responses at
the
previous stage. If the prevalence
of the rare
domain
is
more than
minimal in this stratum, a
substantial proportion of the domain
may go
unrepresented.
Recomm
endations for use and modifications to consider
• The imperfect screening methods in
the
first phase should be
less expensive than
the accurate identification in
the
second
phase. I
f area sampling is used, data from the last census and
other
sources can be used
to allocate the area clusters to
strata based on their prevalence estimates for the rare
population.
29

Last modified 05/07/2020
REFERENCES
1. Needham L, Calafat AM, Barr D. Uses and issues of biomonitoring. Int J Hyg Environ Health 2007;
210(3–4):229–38.
2. Centers for Disease Control and Prevention. The fourth national report on human exposure to
environmental chemicals. Atlanta, GA: Centers for Disease Control and Prevention; 2009.
Available from: https://www.cdc.gov/exposurereport/pdf/fourthreport.pdf
.
3. Namulanda G. Biomonitoring and Environmental Public Health Tracking. Journal of
Environmental Health 2015; 77(9).
4. Council of State and Territorial Epidemiologists. Biomonitoring in public health: epidemiologic
guidance for state, local, and tribal public health agencies. Atlanta, GA: Council of State and
Territorial Epidemiologists; 2012. Available from:
http://www.cste2.org/webpdfs/BioMonISFINAL.pdf
.
5. Lohr SL. Sampling: Design and Analysis. 2
nd
Edition. Brooks/Cole Cenage Learning
6. Sullivan KM. Sampling for epidemiologists. Atlanta, GA: Rollins School of Public Health, Emory
University; 2010.
7. Kalton G. Introduction to survey sampling. Quantitative applications in the social sciences. Vol
35. Thousand Oaks, CA: Sage Publications; 1983.
8. Levy PS and Lemeshow S. Sampling of Populations; Methods and Applications. John Wiley and
Sons Inc
9. Gaganpreet S. Pros and cons of different sampling techniques. Int J Appl Res. 2017;3(7):749–52.
10. Centers for Disease Control and Prevention; Agency for Toxic Substances and Disease Registry.
Per- and Polyfluoroalkyl Substances (PFAS) Exposure Assessment Technical Tools. Atlanta, GA:
Centers for Disease Control and Prevention; Agency for Toxic Substances and Disease Registry;
2018. Available from:
https://www.health.pa.gov/topics/Documents/Environmental%20Health/PFAS%20Exposure%2
0Assessment%20Technical%20Tools.pdf.
11. Centers for Disease Control and Prevention. Community Assessment for Public Health
Emergency Response (CASPER) toolkit. Third edition. Atlanta, GA: Centers for Disease Control
and Prevention; 2019. Available from:
https://www.cdc.gov/nceh/hsb/disaster/casper/docs/CASPER-toolkit-3_508.pdf
.
12. Nafiu LA, Oshungade IO, Adewara. Alternative estimation method for a three-stage cluster
sampling in finite population. Am J Math Stat. 2012;2(6):199–205.
13. Schneider KL, Clark MA, Rakowski W, Lapane WL. Evaluating the impact of non-response bias in
the Behavioral Risk Factor Surveillance System (BRFSS). J Epidemiol Comm Health
2012;66(4):290–5.
14. Galea S,
Tracy M.
Participation rates in epidemiologic studies. Ann Epidemiol. 2007;17(9):643–
53.
15.
Association of Public Health Laboratories. Guidance for Laboratory Biomonitoring Programs:
Developing Biomonitoring Capabilities. 2019. Available from:
https://www.aphl.org/aboutAPHL/publications/Documents/EH-Oct2019-Biomonitoring-
Guidance.pdf
16. National Center for Health Statistics. National Health and Nutrition Examination Survey
(NHANES) Tutorials. Module 2: Sample Design. Hyattsville, MD. Available from:
https://wwwn.cdc.gov/nchs/nhanes/tutorials/Module2.aspx
.
17. Groves R et al. Survey Methodology. 2
nd
Edition. 2009. John Wiley and Sons
30

Last modified 05/07/2020
18. Chen TC, Clark J, Riddles MK, Mohadjer LK, Fakhouri THI. National Health and Nutrition
Examination Survey, 2015-2018: Sample design and estimation procedures. National Center for
Health Statistics. Vital Health Stat 2(184). 2020. Available from:
https://www.cdc.gov/nchs/data/series/sr_02/sr02-184-508.pdf
19. ICF International. Demographic and Health Survey Sampling and Household Listing Manual.
MEASURE DHS, Calverton, Maryland, U.S.A; 2012.
20. Global Adult Tobacco Survey Collaborative Group. Global Adult Tobacco Survey (GATS): Sample
Weights Manual, Version 2.0. Atlanta, GA: Centers for Disease Control and Prevention, 2010.
21. Kalton G. Methods for oversampling rare subpopulations in social surveys. Survey Methodol.
2009;35(2):125–41.
22. Repp KK, Hawes E, Rees K, Vorderstrasse B, Mohnkern S. Lessons learned from an
epidemiologist-led countywide community assessment for public health emergency response
(CASPER) in Oregon. J Public Health Manag Pract. 2019;25(5):472–8.
23. Centers for Disease Control and Prevention. Sampling methodology. Community Assessment for
Public Health Emergency Response (CASPER). Atlanta, GA. Available from:
https://www.cdc.gov/nceh/casper/sampling-methodology.htm
.
24. Johnson CL,
Dohrmann SM, Burt VL, Mohadjer LK. National Health and Nutrition Examination
Survey: Sample design, 2011–2014. National Center for Health Statistics. Vital Health Stat
2(162). 2014
.. Available from: https://www.cdc.gov/nchs/data/series/sr_02/sr02_162.pdf.
31

_____________________________________________________________________________________
Last modified 05/07/2020
Suggested citation: Environmental Public Health Tracking Program, Centers for Disease Control and
Prevention. Guidance, examples and tools for probability sampling when designing a population-based
biomonitoring study. 2020.
CONTRIBUTORS
Biomonitoring Study Design Team, Environmental Public Health Tracking Program, Centers for Disease
Control and Prevention.
Name Affiliation
Gonza Namulanda CDC–Division of Environmental Health Science and Practice
Kristin Dortch CDC–Division of Laboratory Sciences
Wellington Onyenwe CDC–Division of Laboratory Sciences
Karen Wilson NY Tracking Program
Monica Nordstrom NY Tracking Program
Matt Roach AZ Tracking Program
Hsin Lin Cox AZ Tracking Program
Niki Lajevardi-Khosh AZ Tracking Program
Melissa Kretchmer AZ Tracking Program
Amanda Cosser NH Biomonitoring program
Jessie Sagona NH Tracking Program
Cliff Mitchell MD Tracking Program
We acknowledge and thank all reviewers from the Centers for Disease Control and Prevention’s National
Center for Health Statistics, Division of Laboratory Sciences, and Environmental Public Health Tracking
Program (Tracking Program); the Agency for Toxic Substances and Disease Registry (ATSDR); and the
Tracking Program State/local recipients for their feedback on improving this document. We also
acknowledge and thank Nerissa Wu, Kathleen Attfield and Jennifer Mann from the California
Department of Public Health for their participation on the Biomonitoring Study Design Team, and for
their input in developing this document.
ENVIRONMENTAL PUBLIC HEALTH TRACKING
32
